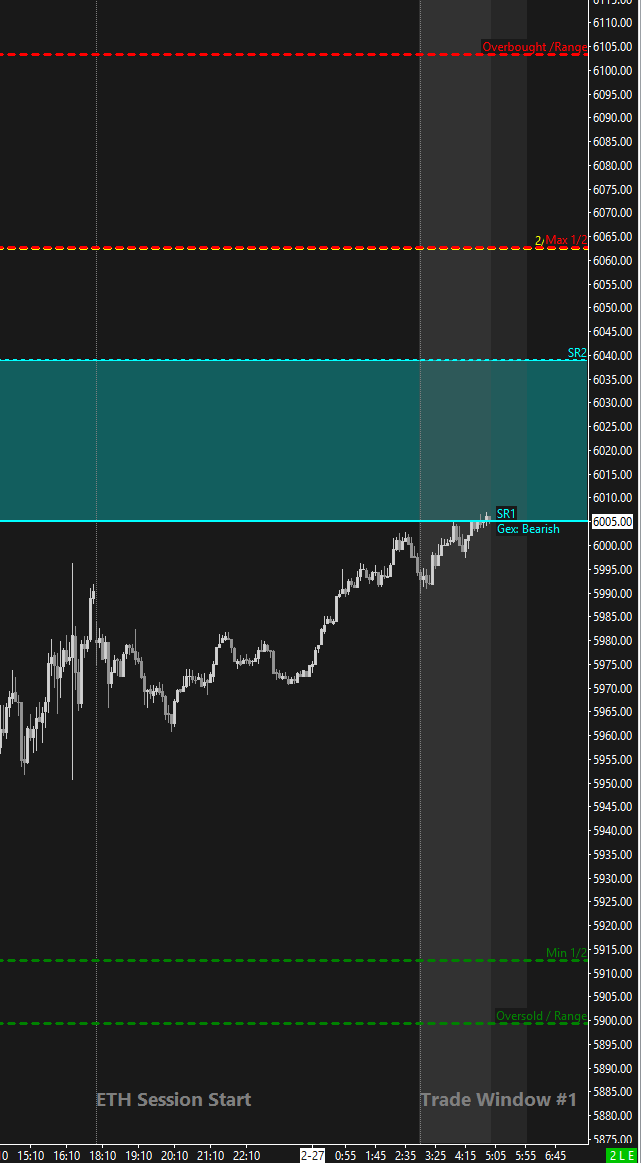
Structure + Gamma Levels:
Key Options Levels:
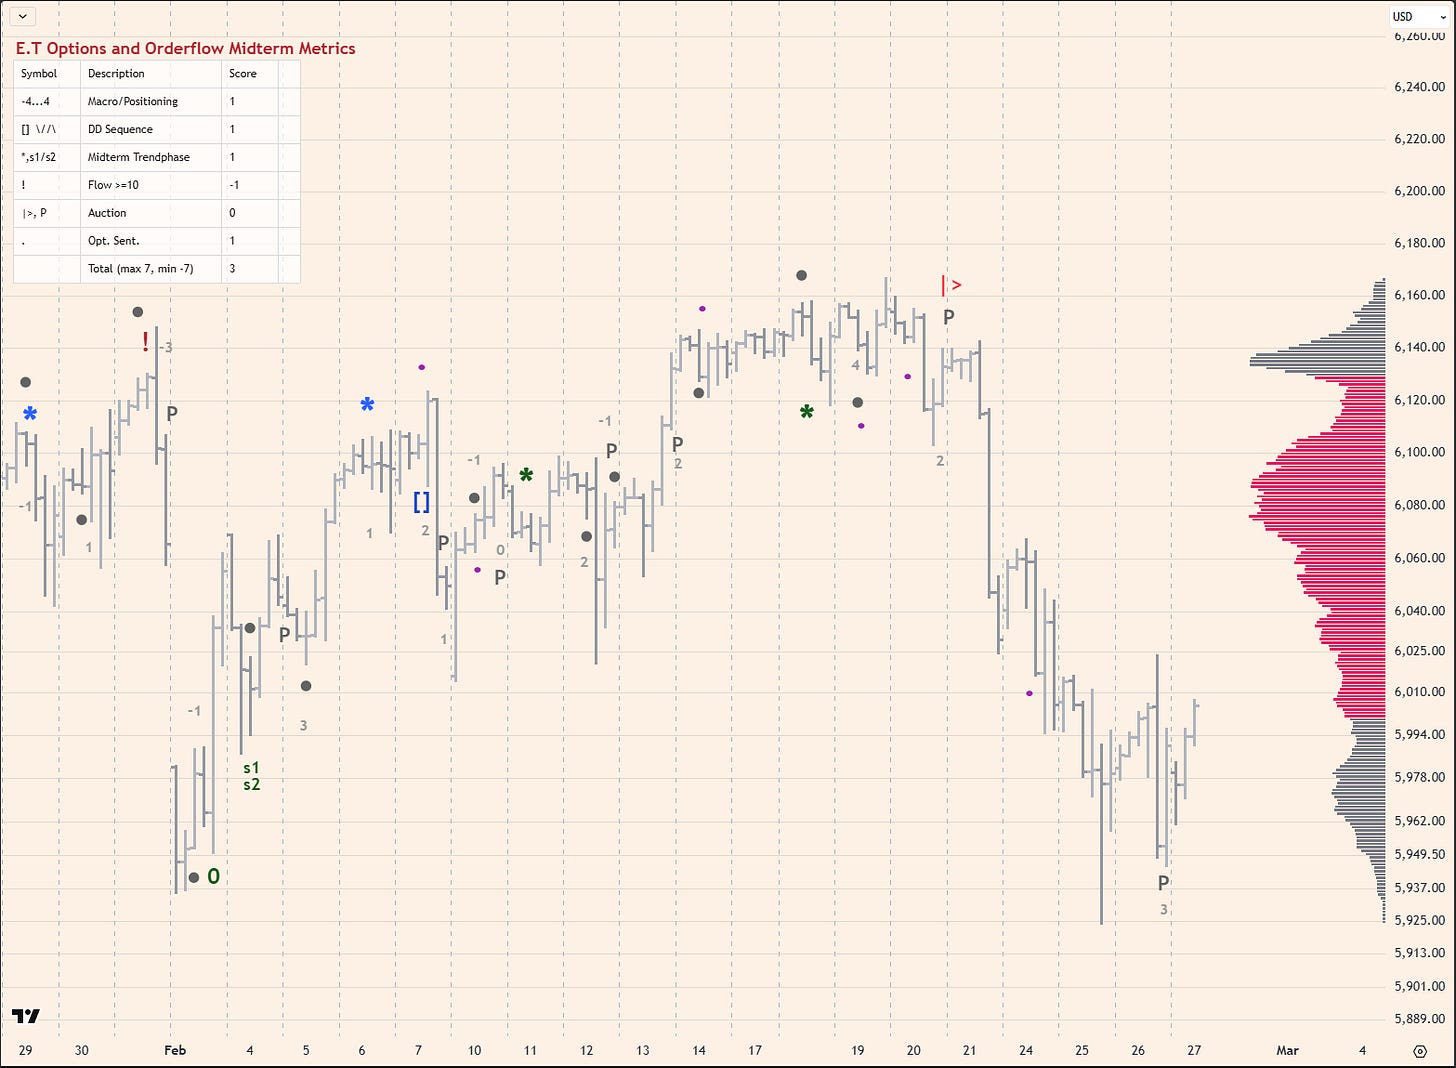
SPX TrendPhase:
Midterm Cumulative:
//Actionable Levels//
Resistance: 6062
Pivot: 5971.5
Support: 5900
Key takeways:
Some changes on midterm front, we have +3 score from +2. Personally, Im not doing anything with my position as I already have a bit too heavy long position - I mentioned it few posts earlier where I didnt lighten it down when score changed to 2 from 4.
There is still fear in the market which can be gauged on GEX Ladder (inverted expiration averages). But this is rarely a leading indicator.
The leading indicator on the other hand is wide bullish spread between sr1 and sr2, over 30 points today.
Some people went doom crazy on this correction, but have in mind, we are at the end of february which is typicaly bearish period from seasonality perspective. Actually all second part of feb. is. From seasonality perspective bullish market starts in second half of march. So, there still can be some turmoil ahead.
Today we have GDP data, it might affect macro/positioning strategy and thus midterm scoring.
Notes:
Yesterday’s HPI signals and other option metrics.
Yesterday, I wrote about important addition to HPI research, GEX Ladder regime switch. Take a look at it if you haven’t already.
So in that regard I made some changes to dashboard and HPI view in the emini.today terminal. Also, yesterday there was this unfortunate example where we almost hit exit signal on bullish position but HPI never made it to +100 (which is exit signal). I have checked that in history and it looks much better to set exit level of HPI to 95/-95. Especially in RTH session, where HPI tends to have less volatility in it.
So, from now on we have GEX Ladder averages on HPI chart in the terminal, so one can quickly see if market is ‘normal’.
As to dashboard I have added some stats + filtered stats (filtered means that its using GEX Ladder regime, it basically stops trading when regime is flipped). I will do a seaparate post on that soon.


