


The Perfect Regime Switch?
Hedge Pressure Index vs. GEX Ladder Averages.

This is a working thesis for now but looks like a very important piece of information which might help in these rather rare market conditions which possibly eliminate some of dealers’ pressure.
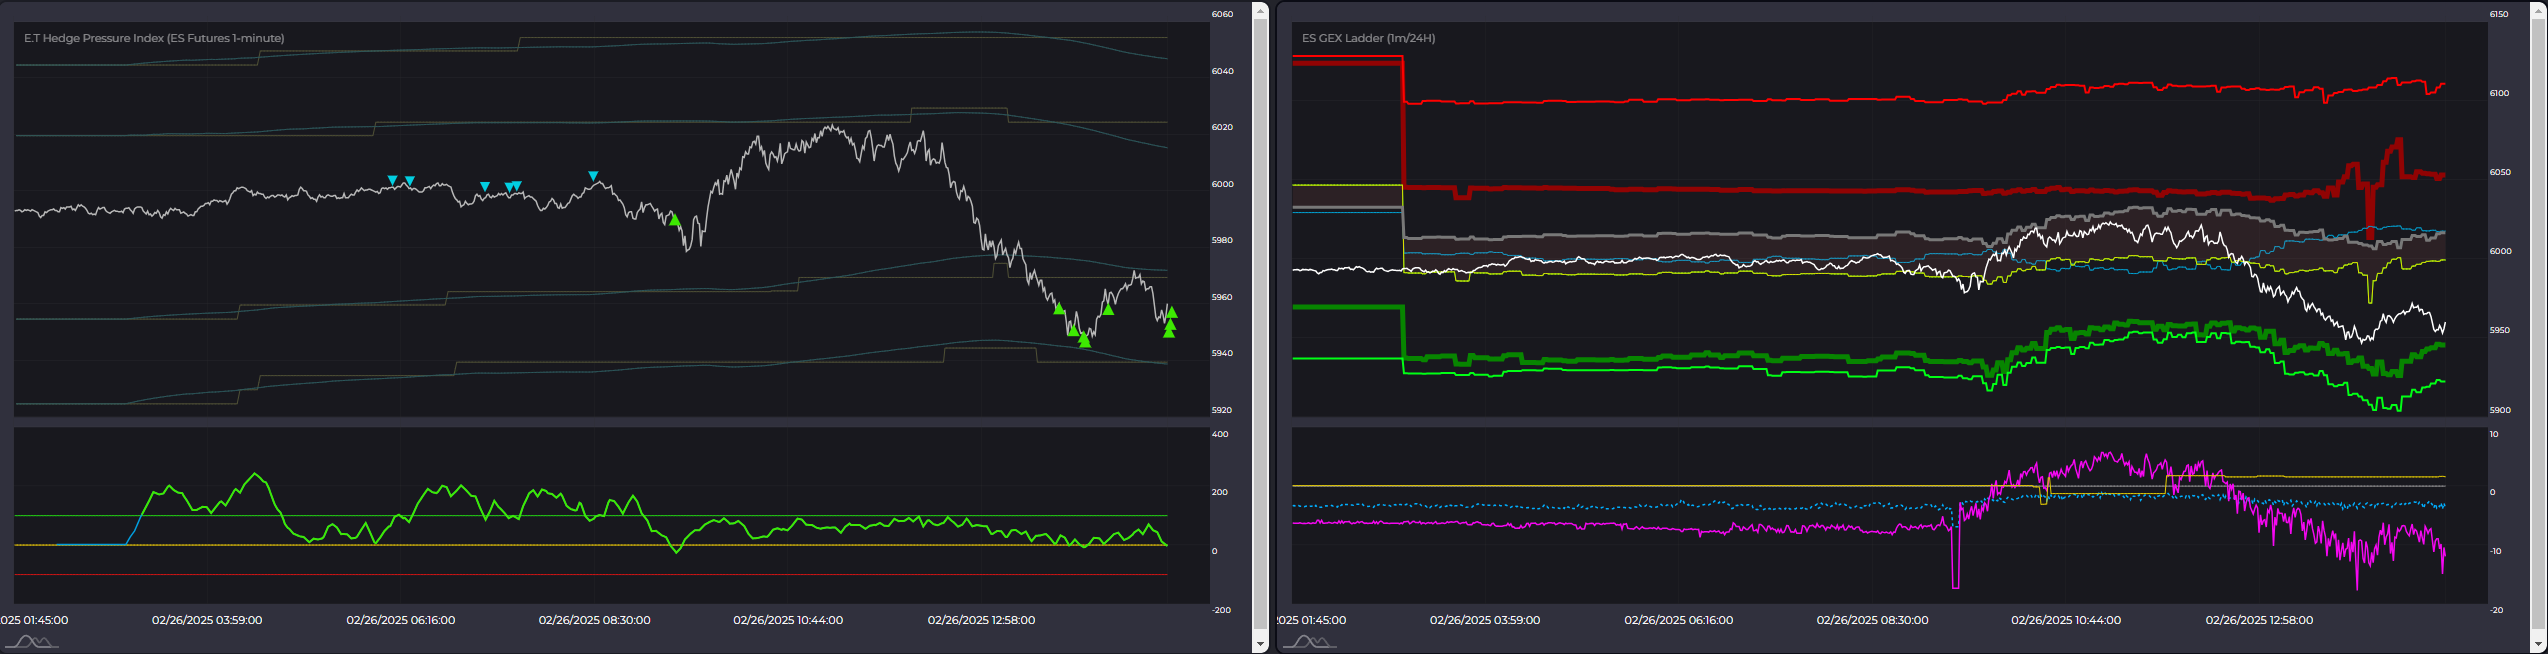
If you look at emini.today terminal and launch ES GEX Ladder chart you will see these two metrics which we call ‘ladder averages’. Thick grey line and thin yellow one. These are kind of zero gamma levels calculated on the fly from two different sets of expirations (and also set of strikes) - one of my personal formulas.

Now, what’s interesting here is that well over 80% of time these two values are positioned so that yellow one is above grey line, which basically represents normal situation in options world where closer expirations have higher zero values than further expirations.
Long before I formulated Hedge Pressure Index calculation, I knew that market’s volatility tends to rise when these two ‘averages’ are flipped (yellow below grey). But never before was it so clearly visible as when confronted with HPI study.
So the hypothesis backed with some recent data is that HPI impact on market is relatively smaller when ‘zero averages’ are flipped. And maybe it can be used as a filter or strategy-kill-switch. Don’t use HPI when GEX Ladder Averages are flipped? Few examples:


Now, below you can see last sessions with inverted GEX Ladder Averages:

I plan to add these two averages to analysis and dashboard which monitors potential strategies based on HPI so that it will be easy to compare results over time.
If you are interested in subscribing to Hedge Pressure Index then head to my webiste: