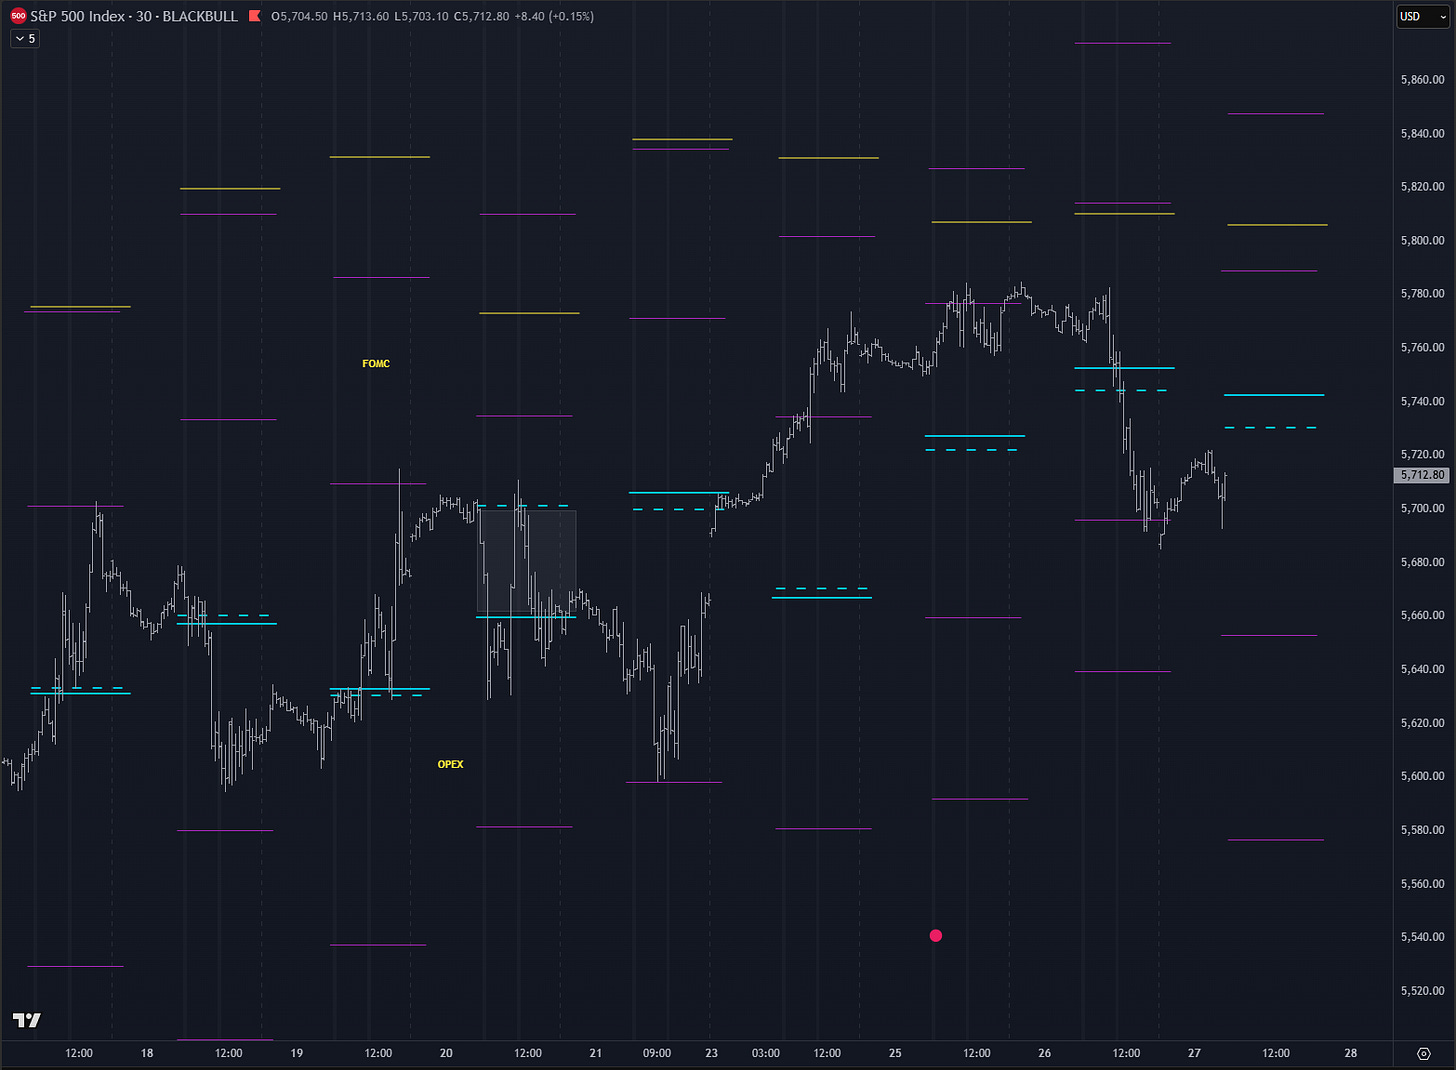
Key Orderflow and Options Levels (ES Futures):
Options Levels (middle and right chart) show significant option prices for the session. Best practice is to look for confluence between levels on center and right chart. These levels should be +/- 5 points max away from each other.
TrendPhase (SPX):
There are three types of signals on this chart, represented by small circles. Circles below price are bullish signals, above price are bearish signals.
Midterm Cumulative:
//Midterm Metrics//
Macro/Positioning: 0
OptionsTrendPhase: 1
Auction/Orderflow: -1
Alerts: -
Key takeways:
Level confluence at 5702-5698.
Yesterday’s bearish auction made orderflow switch to short (-1).
We had very interesting market resume at 18:00 EST, price swept liq. zone which were basically stops and move rapidly up. Almost as if this was orchestrated :)
There is definietly something fishy in that decline and personally Im not doing anything with my longs for now. Obviously I would like to see a buyer stepping in today or maybe break above pivot and trade bullish sequence.
Notes:
Recap of yesterday’s HPI and other options metrics + Orderflow Structure.
Yesterday’s orderflow and options structure.


