Pre-Open Commentary | Mar 26, 25
Condensed Insight Before the Bell.
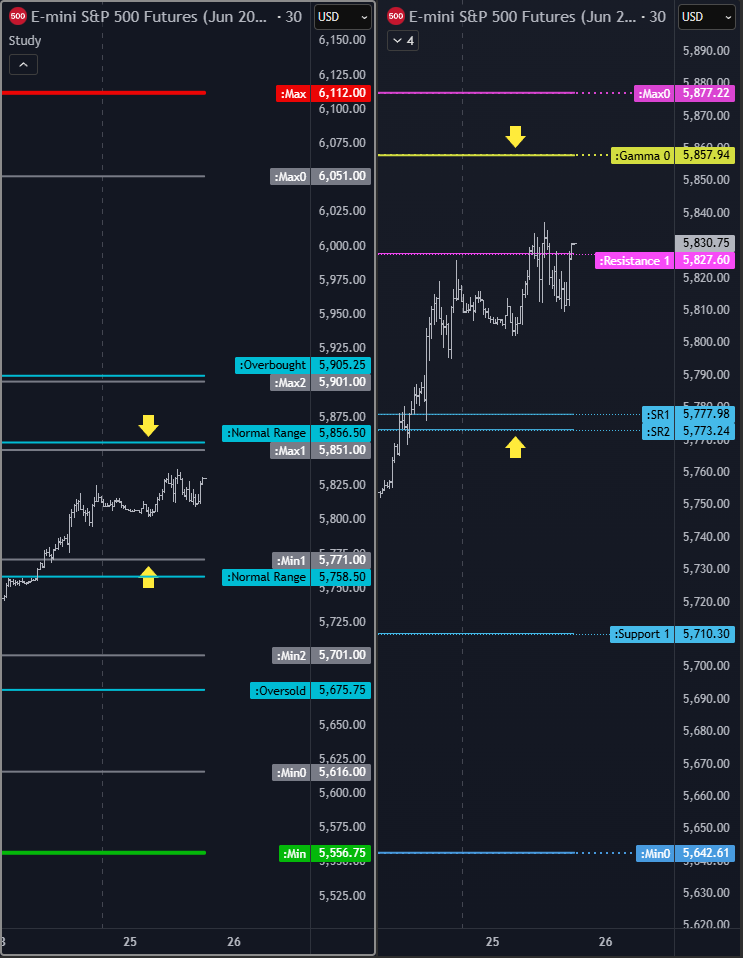
Key Orderflow and Options Levels (ES Futures):

Options Levels (middle and right chart) show significant option prices for the session. Best practice is to look for confluence between levels on center and right chart. These levels should be +/- 5 points max away from each other.
TrendPhase (SPX):
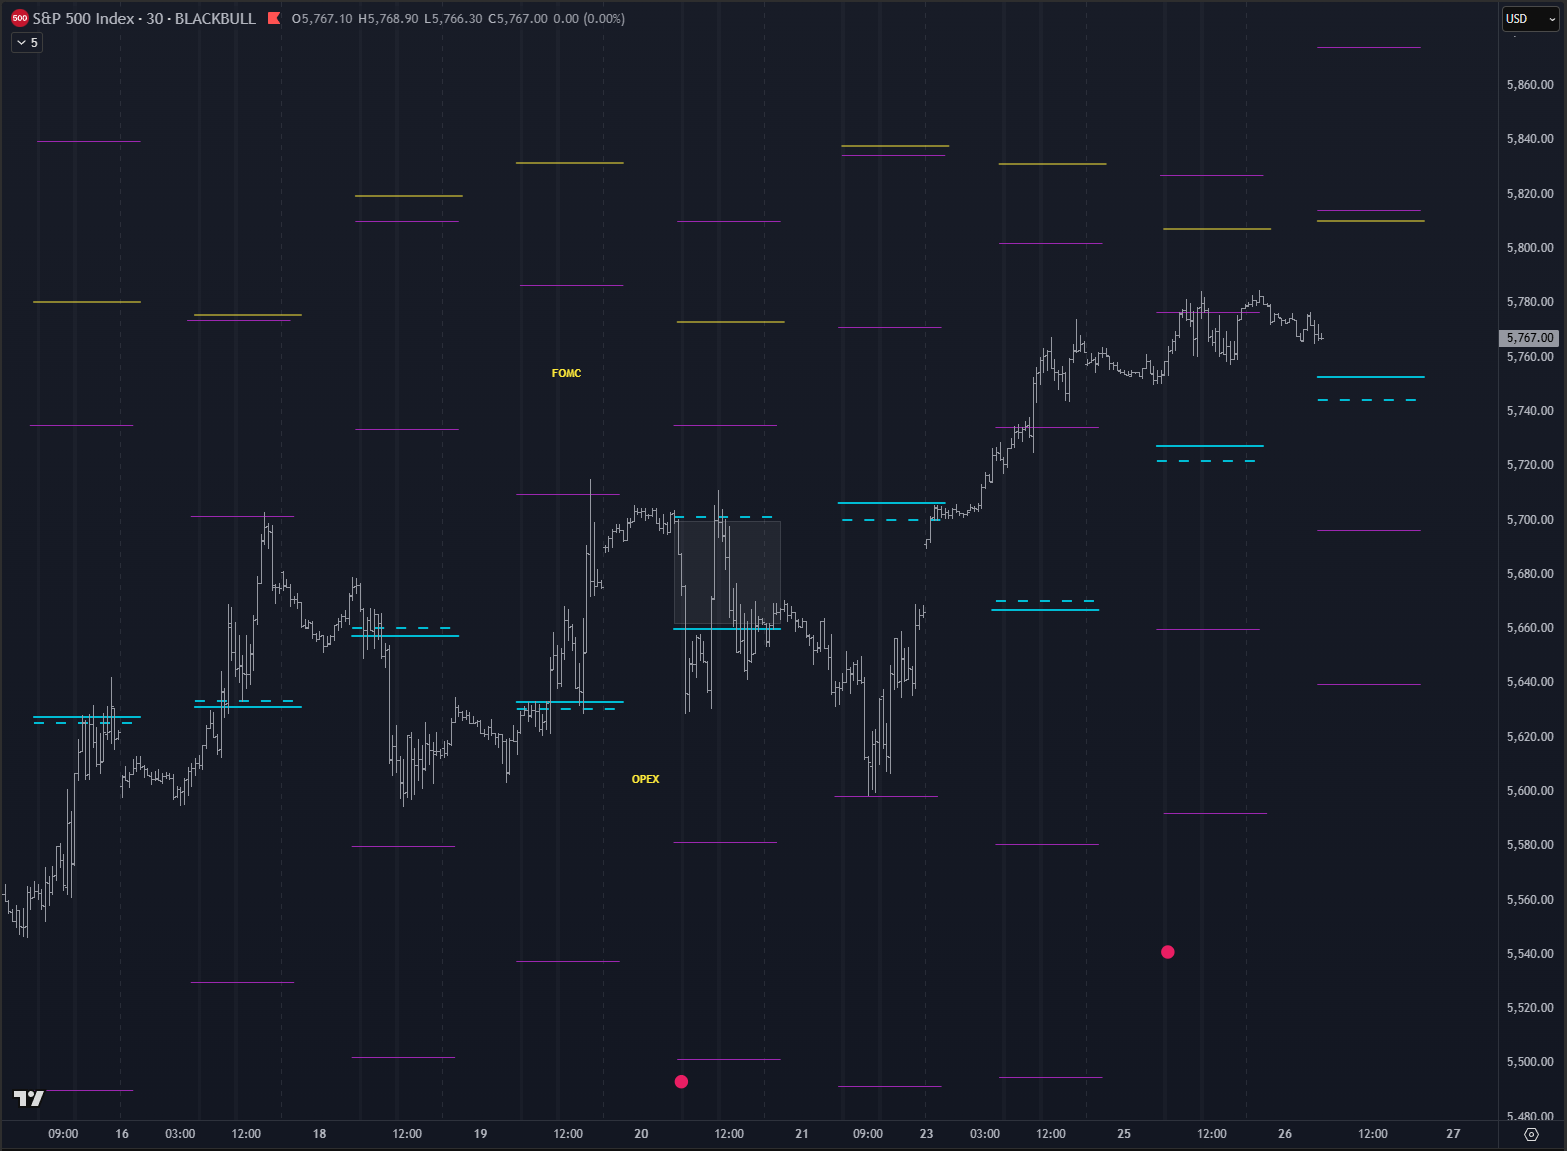
There are three types of signals on this chart, represented by small circles. Circles below price are bullish signals, above price are bearish signals.
Midterm Cumulative:
//Midterm Metrics//
Macro/Positioning: 0
OptionsTrendPhase: 1
Auction/Orderflow: 1
Alerts: -
Key takeways:
Level confluence at 5794-5784 and 5750-45.
Notes:
Recap of yesterday’s HPI and other options metrics + Orderflow Structure.

Yesterday’s orderflow and options structure.