


Pre-Open Commentary | Mar 25, 25
Condensed Insight Before the Bell.
Key Orderflow and Options Levels (ES Futures):

Options Levels (middle and right chart) show significant option prices for the session. Best practice is to look for confluence between levels on center and right chart. These levels should be +/- 5 points max away from each other.
TrendPhase (SPX):

There are three types of signals on this chart, represented by small circles. Circles below price are bullish signals, above price are bearish signals.
Midterm Cumulative:
//Midterm Metrics//
Macro/Positioning: 0
OptionsTrendPhase: 1
Auction/Orderflow: 1
Alerts: -
Key takeways:
Today we have weak confluence on options levels, meaning supporting levels are confluencing with structural ones, like support/gamma etc. It basically means there is lower probability of price being rejected at these prices. I use confirmation for such levels: 5857, 5771.
Im also interested in orderflow area 5743-40 which is pivot confluencig with previous range high. Statistically price re-entering range declines to outer range end so it should be protected by bulls.
I missed one detail on friday auction, which at EOD hinted to bullish signal. As you can see auction/orderflow and trendphase are now bullish. The only part missing now is macro/positioning which still is in neutral.
Seasonality is bullish now.
Notes:
Recap of yesterday’s HPI and other options metrics + Orderflow Structure.
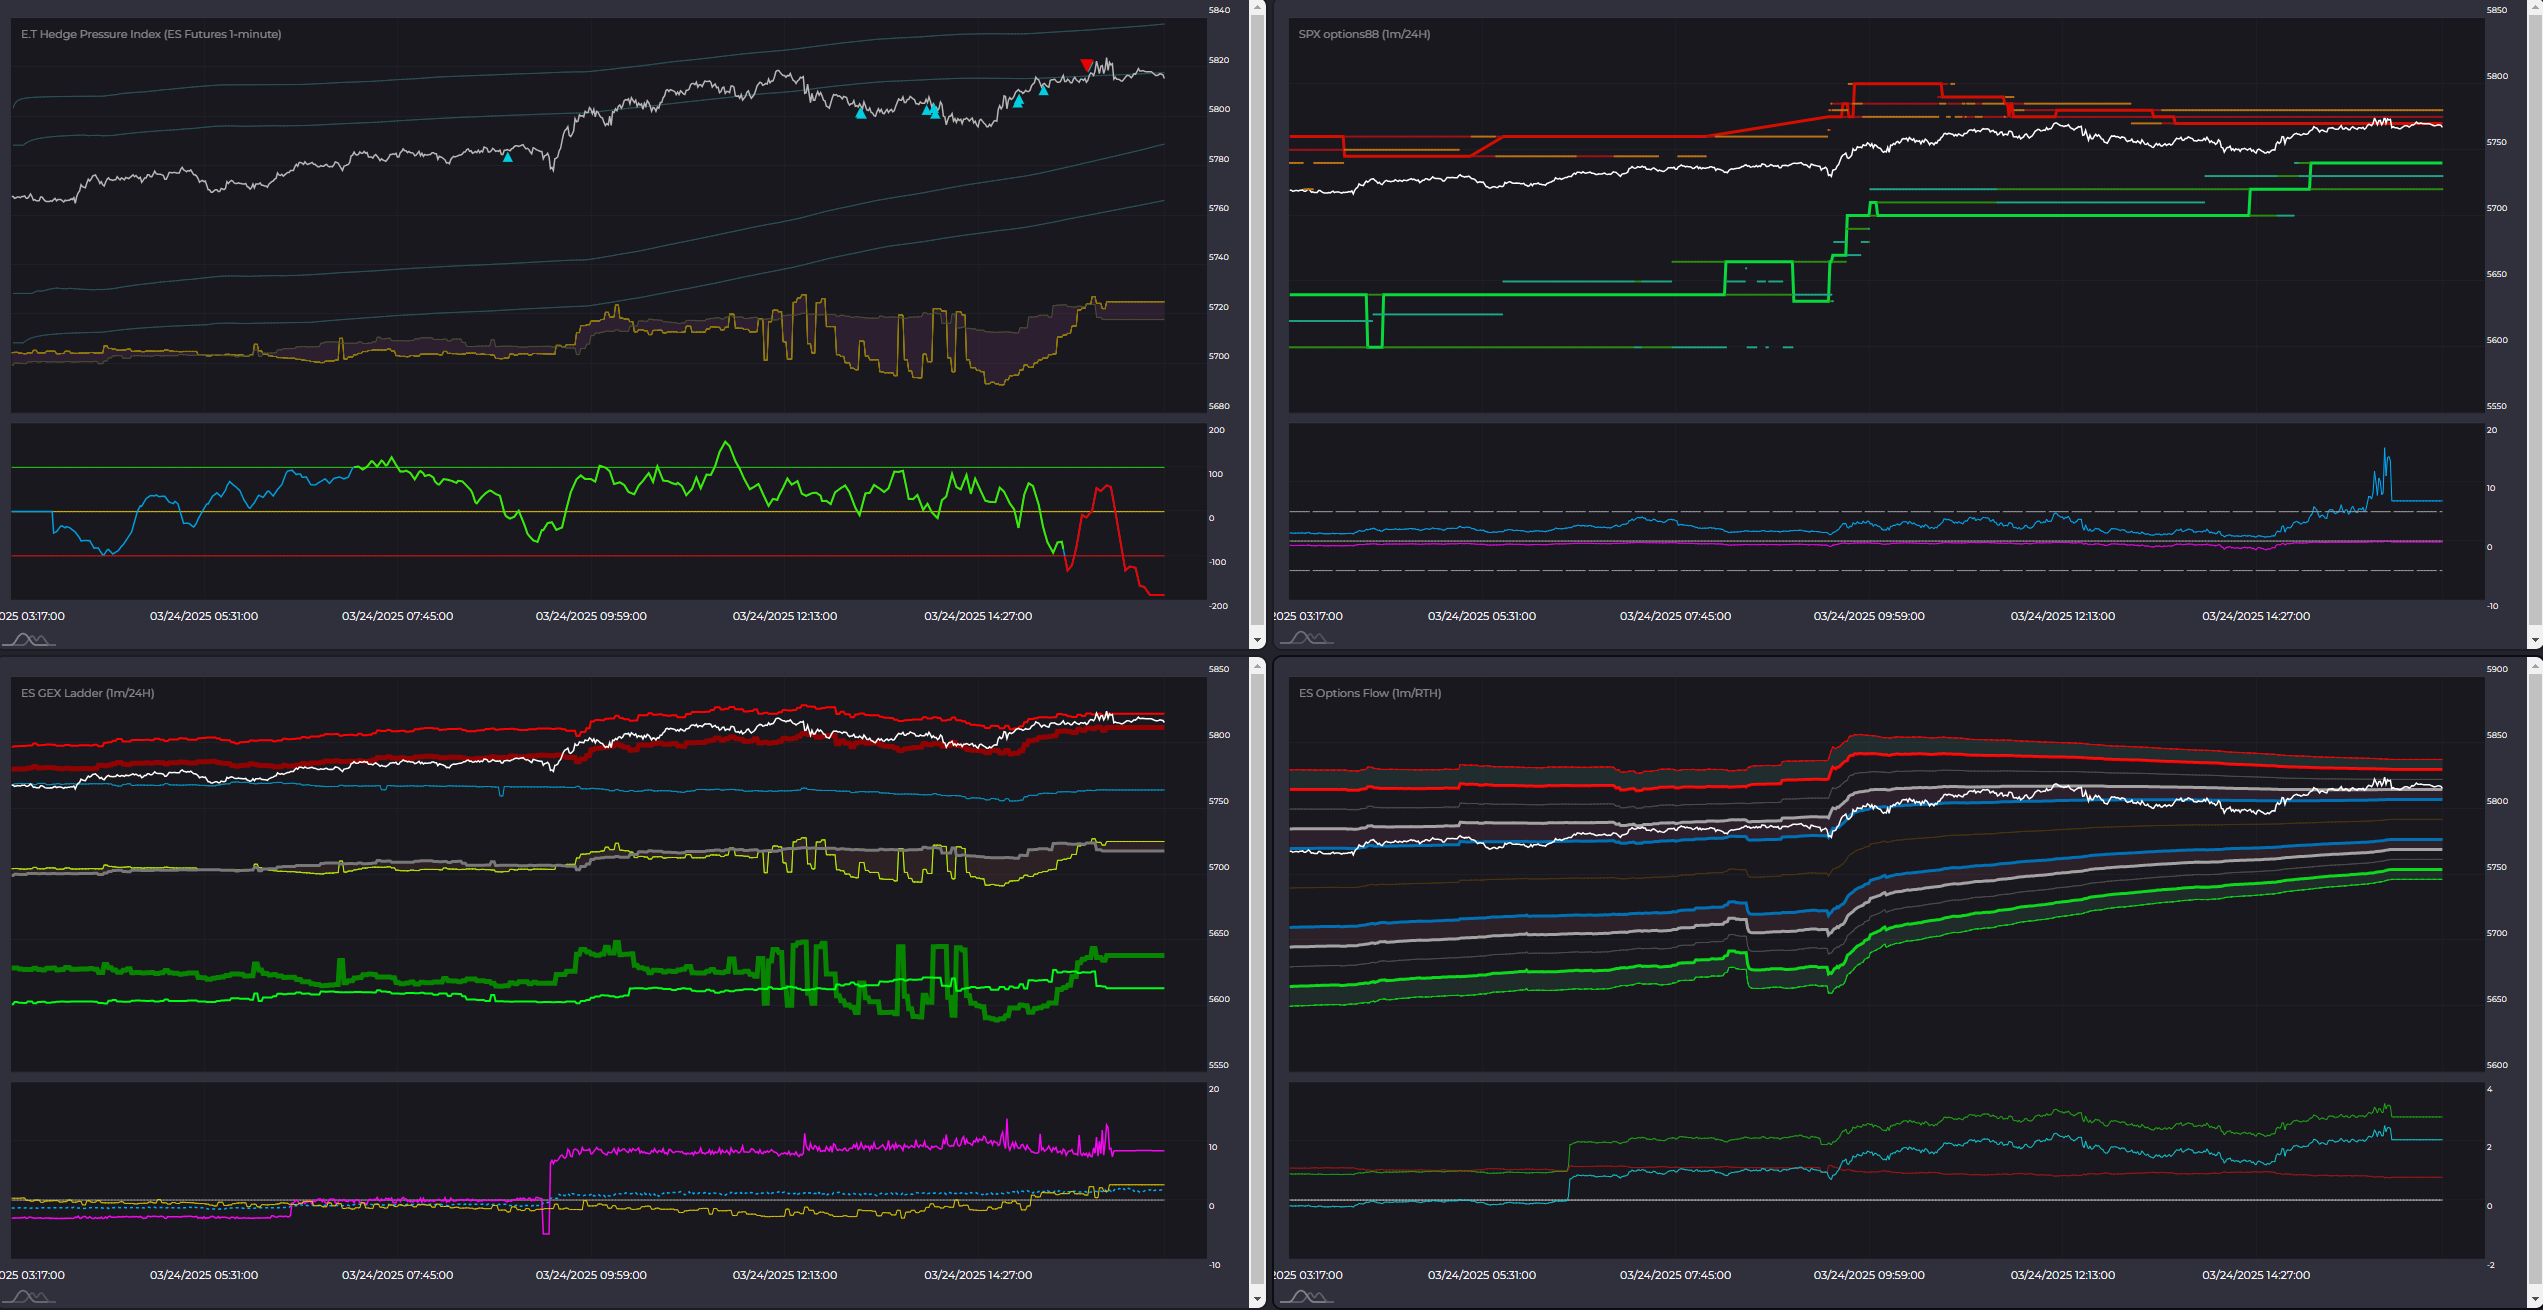
Yesterday’s orderflow and options structure.
