


Pre-Open Commentary | Mar 24, 25
Condensed Insight Before the Bell.
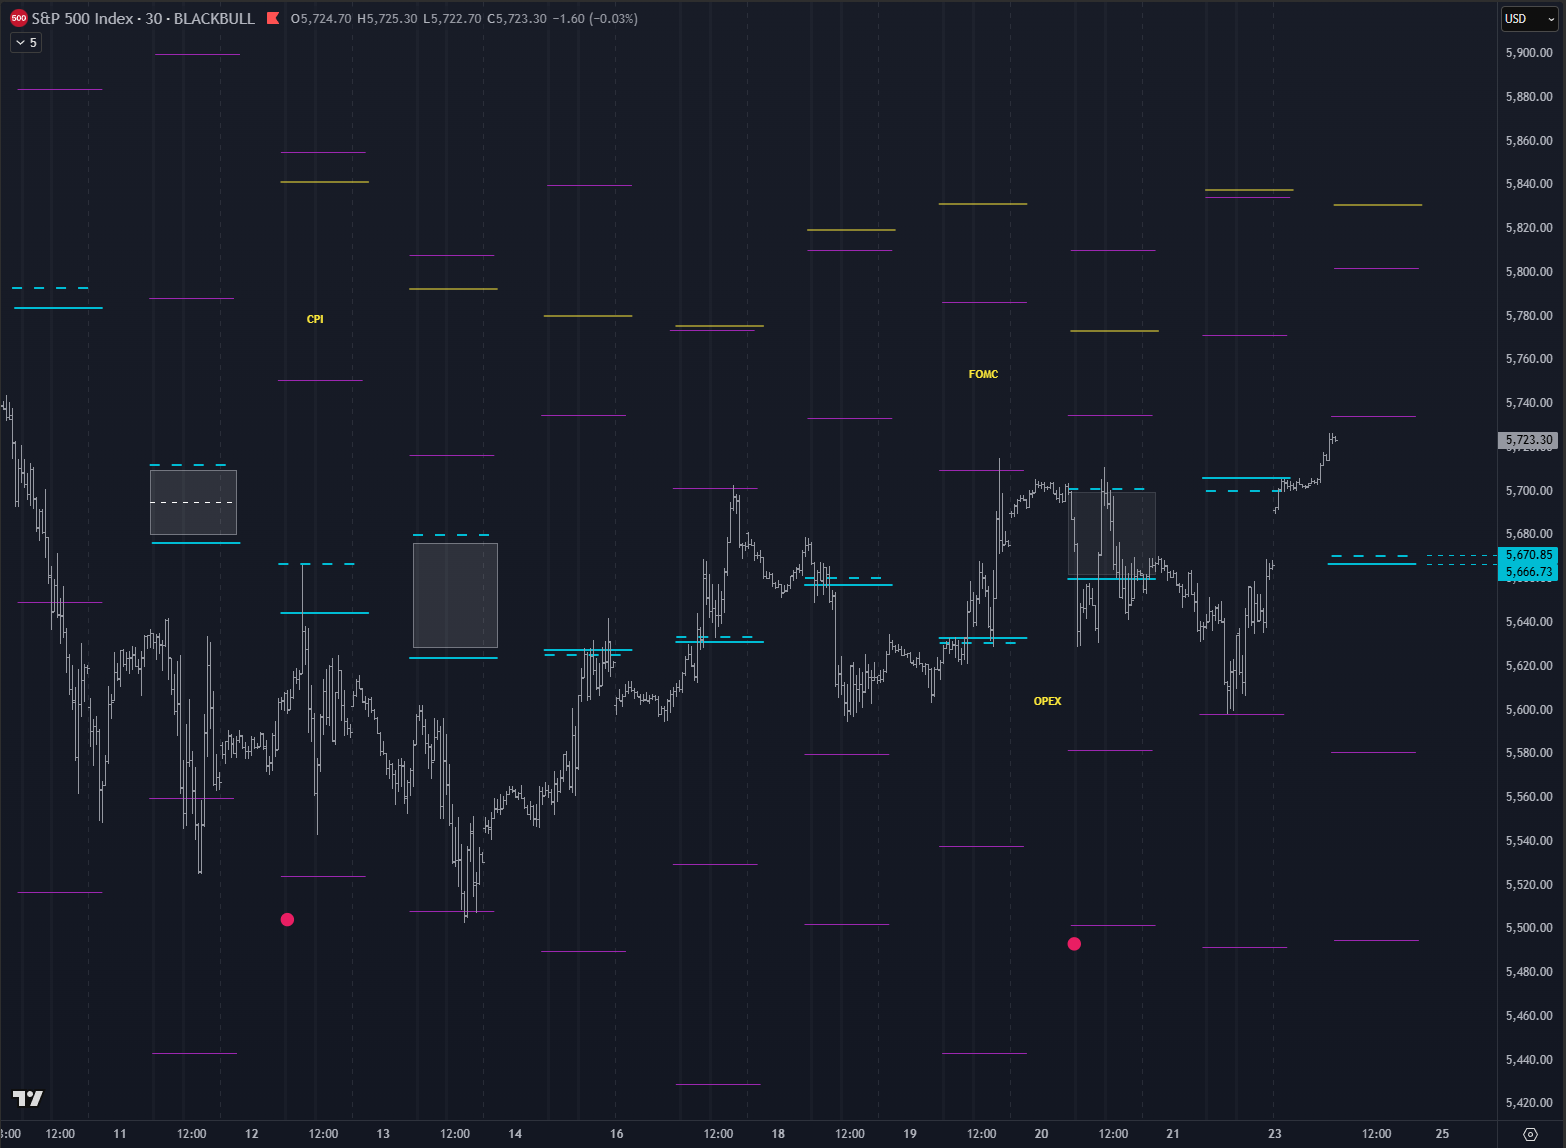
Key Orderflow and Options Levels (ES Futures):

Options Levels (middle and right chart) show significant option prices for the session. Best practice is to look for confluence between levels on center and right chart. These levels should be +/- 5 points max away from each other.
TrendPhase (SPX):
There are three types of signals on this chart, represented by small circles. Circles below price are bullish signals, above price are bearish signals.
Midterm Cumulative:
//Midterm Metrics//
Macro/Positioning: 0
OptionsTrendPhase: 1
Auction/Orderflow: -1
Alerts: 1
Key takeways:
Confluence on options levels at: 5629-26 and 5620 so basically 5629-20 zone.
Market opened exactly on the edge of range which for now is low of day. In such configuration, resistance area is not so significant as when market opens inside of range. Expecting some reaction in “liquidity” zone but this is just scalp opportunity today.
Notes:
Recap of yesterday’s HPI and other options metrics + Orderflow Structure.

Yesterday’s orderflow and options structure.
