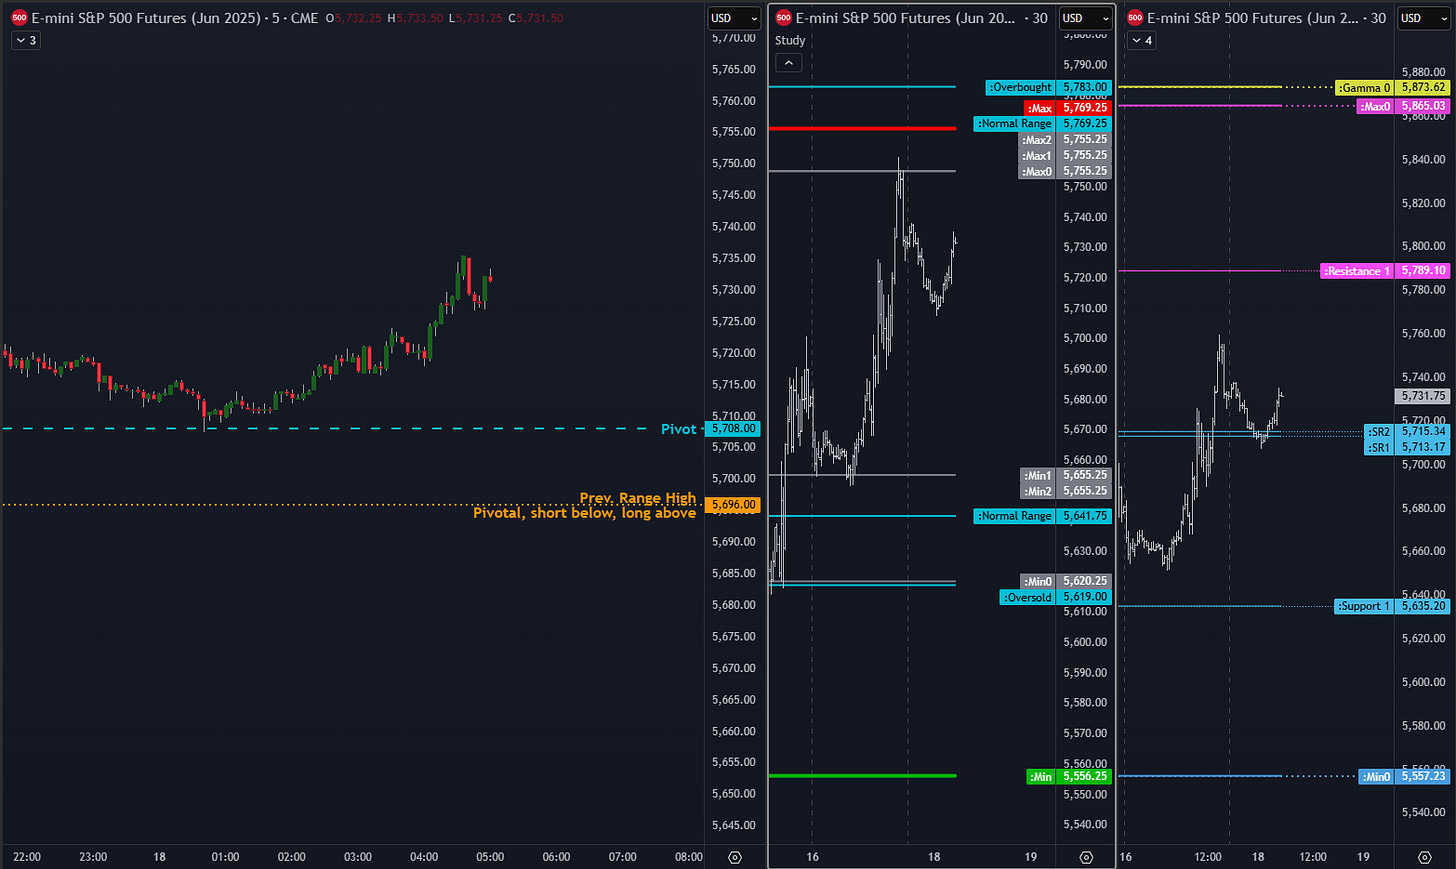
Key Orderflow and Options Levels (ES Futures - June contract):
Options Levels (middle and right chart) show significant option prices for the session. Best practice is to look for confluence between levels on center and right chart. These levels should be +/- 5 points max away from each other.
TrendPhase (SPX):
There are three types of signals on this chart, represented by small circles. Circles below price are bullish signals, above price are bearish signals.
Midterm Cumulative:
This section is undergoing some redo and simplification.
//Midterm Metrics//
Macro/Positioning: 0
OptionsTrendPhase: 1
Auction/Orderflow: -1
Alerts: 1
Key takeways:
I posted today’s pivot after close in discord, it was already hit so be careful if next attempt happens (wait for reaction).
Midterm orderflow still no confirmation of long, same as Macro/Positioning strategy. But trendphase long signal at the bottom is very strong historically so definietly im not feeling bad with midterm long.
Notes:
Recap of yesterday’s HPI and other options metrics + Orderflow Structure.
What is noticable for me at this stage of researching HPI is that signals (red/green arrows) which occure in HPI bands have the best potential and hit rate. Also, color of HPI works best if it is in the same direction as Ladder GEX. Will go through it in more detail in upcoming new video on HPI.
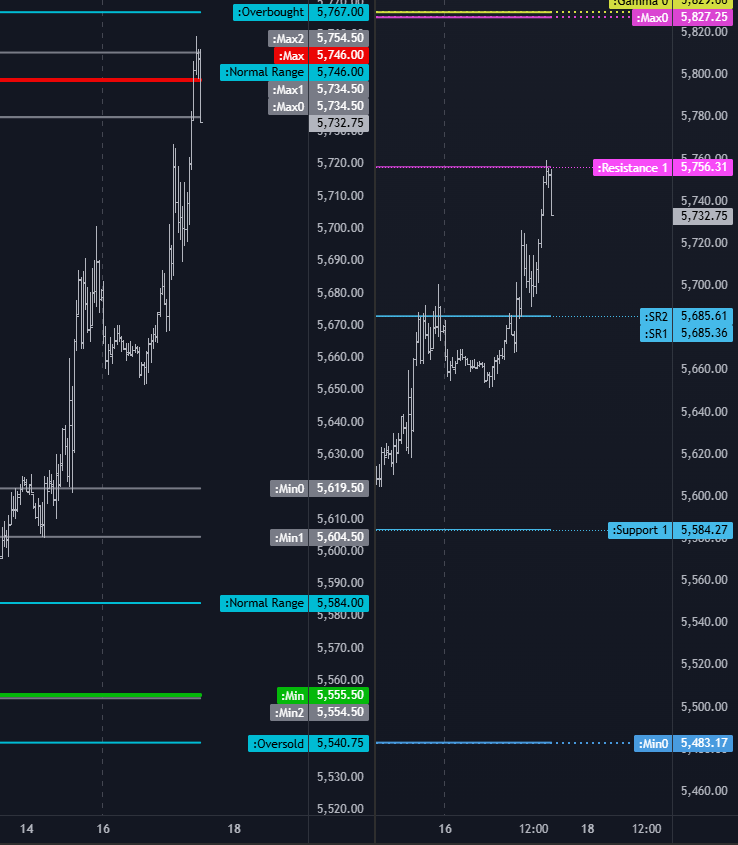
Yesterday’s orderflow and options structure.
Yesterday was a good example how two options charts work. Look for closest confluence between levels on both charts. Yesterday it was high of session Max2 (left chart) and Resistance 1 (right chart) confluence.


