


Pre-Open Commentary | Mar 17, 25 (June contract roll)
Condensed Insight Before the Bell.
Key Orderflow and Options Levels (ES Futures - June contract):
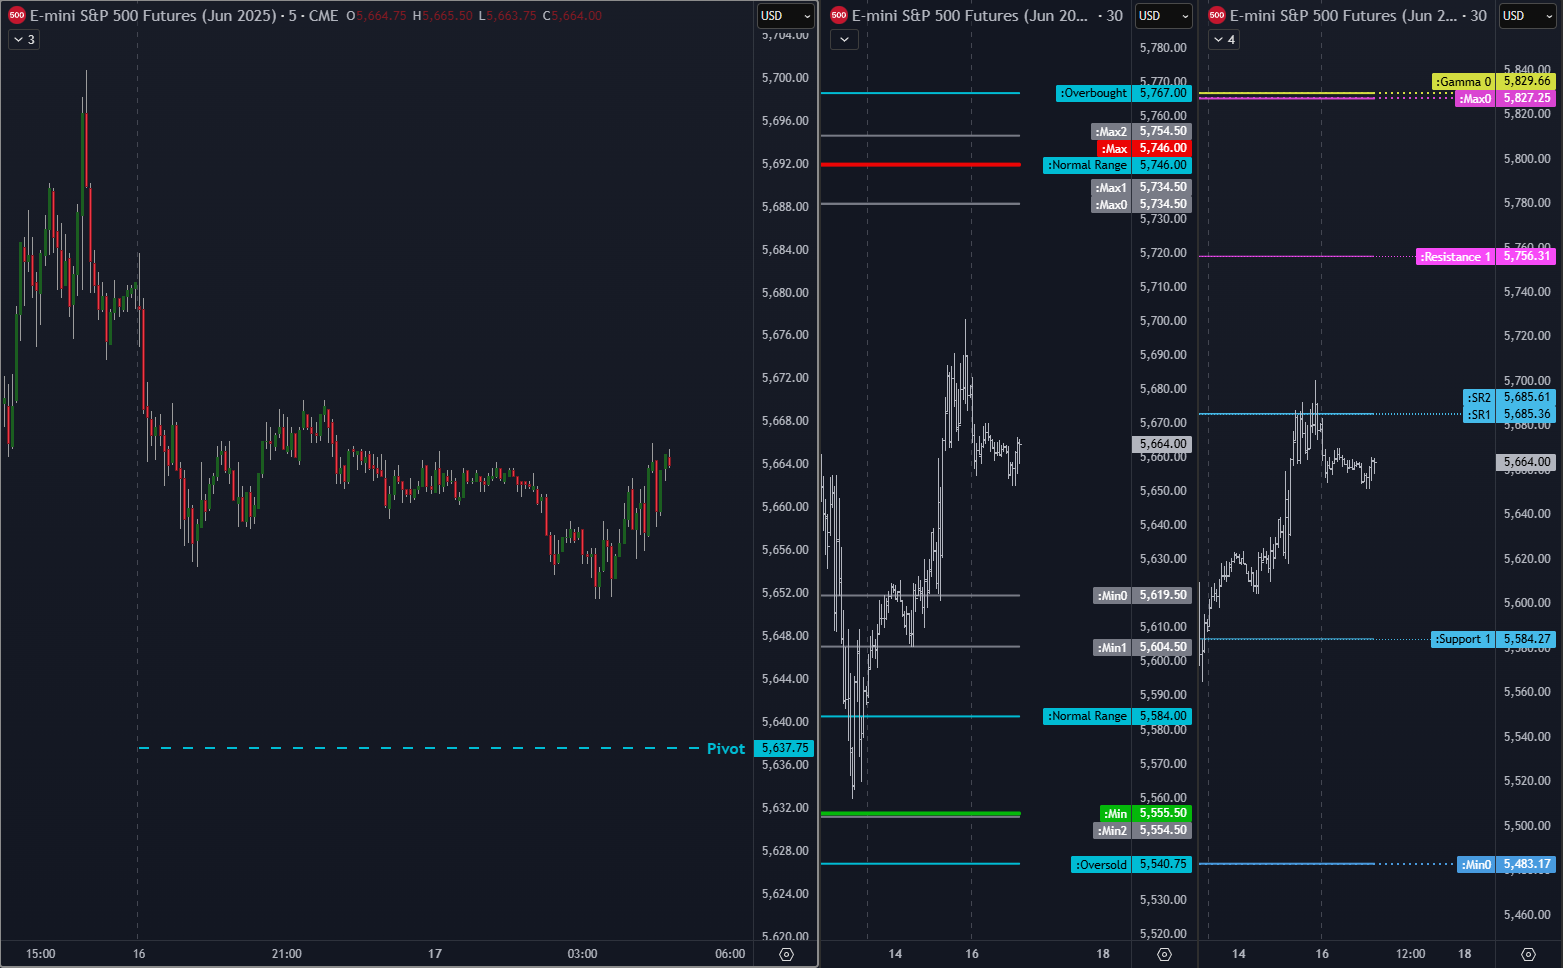
As you can see, chart on the left with orderflow levels has only Pivot line today. The reason for that is I tend to not rely on orderflow structure during rollover period (usually 2-3 days around it). So full orderflow structure will be back tomorrow or day after tomorrow.
TrendPhase (SPX):

Midterm Cumulative:
This section is undergoing some redo and simplification.
//Midterm Metrics//
Macro/Positioning: 0
OptionsTrendPhase: 1
Auction/Orderflow: -1
Alerts: 1
Key takeways:
Entering opex week and futures rollover. I try to keep small size in that period intraday and as I stated above, I don’t rely so much on orderflow for few days.
I have noticed a lot of big financial accounts/names calling for market bottom which although I agree, dont make me more confident. Again, because I rushed too quickly into that long im still not adding.
Notes:
Recap of yesterday’s HPI and other options metrics + Orderflow Structure.

Yesterday’s orderflow structure.

Another clear and relatively easy session from orderflow structure perspective. Unfortunetly I made a mistake in calculating resistanc level, I marked that on chart.
Which chart is more important?
The one with:
Resietance 1 - 5756
Max0 - 5827
Or the middle one:
Max - 5746
:overbought 5767
How to interpret these levels, which are more important for day trading?