


Pre-Open Commentary | July 11, 24
Condensed Insight Before the Bell.
Key takeways:
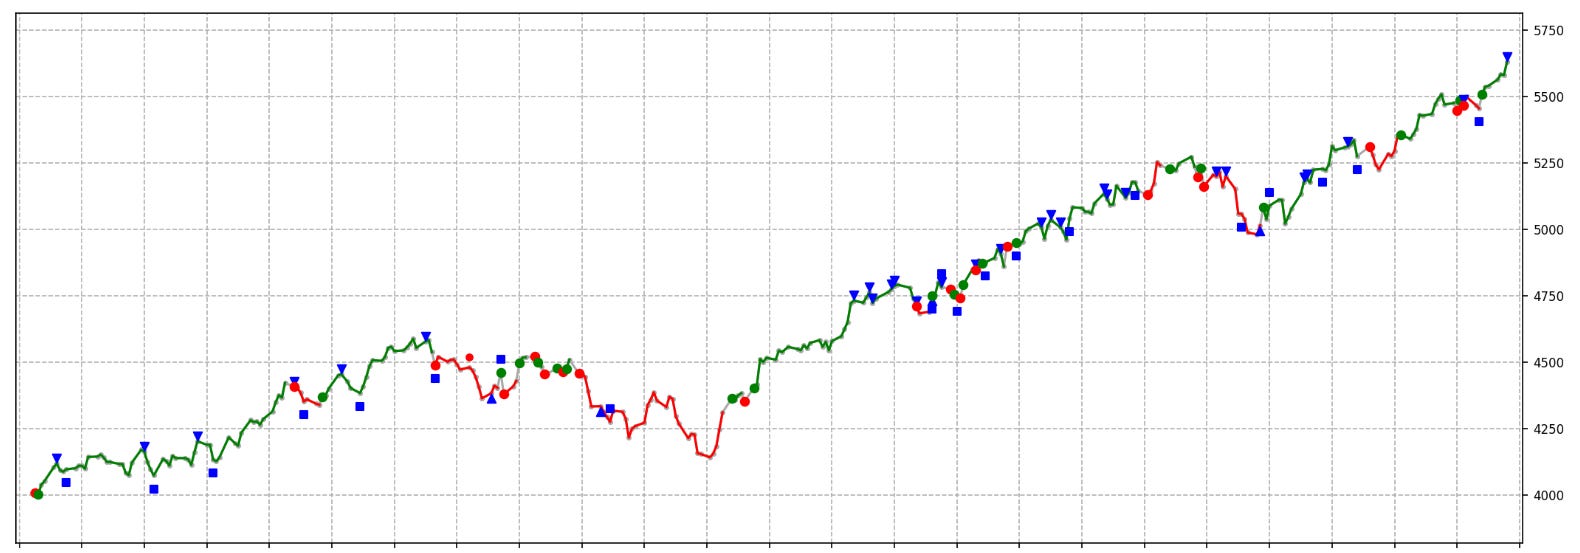
Here we are, CPI Thursday. Pullback sequence in uptrend signal has been printed today. So first couple words on this signal. In the past it either slowed the price (consolidate) or actually marked local top. (Blue triangle pointing down. The end of sequence is blue square aprox. 3 sessions after that signal).
Primarly this is swing/midterm signal and means that one should reduce long position or even close it if there is a confluence with other important metrics. Do we have such confluence now? Not really. Obviously we are still awaiting CPI data but even macro model is not going to produce short signal just yet.
So, based on that warning sign I am expecting rather sideway action and maybe sharp, controled, pullback within upcoming 3 sessions.
Looking at intraday metrics though, we have no signs which would prove that this is the day to attack on short side with confidence.
So, my plan is to set some buy limit orders for today. 5640 area seems particularly interesting, but less likely we can get it. Other interesting points below.
Resistance: 5720-30, 5750
Support: 5672, 5660, 5640
Notes/Observations/Issues:
One more thing which I find extremely interesting is we are slowly aproaching cumulative gamma level which from what I remember was never hit before. It is moving a bit each session, sort of runs away from price. But recent pace of market seems like its getting there. Right now the level is aprox. 5730 (SPX) so about 5780 ES. Its not going to happen today most likely, but i’m very curious what would happen if price reaches it.
Pre-Open Commentary distills key takeaways from the analysis of the London GEX and Structure posts and also serves as my personal journal (sort of).