Pre-Open Commentary | Apr 9, 25
Condensed Insight Before the Bell.
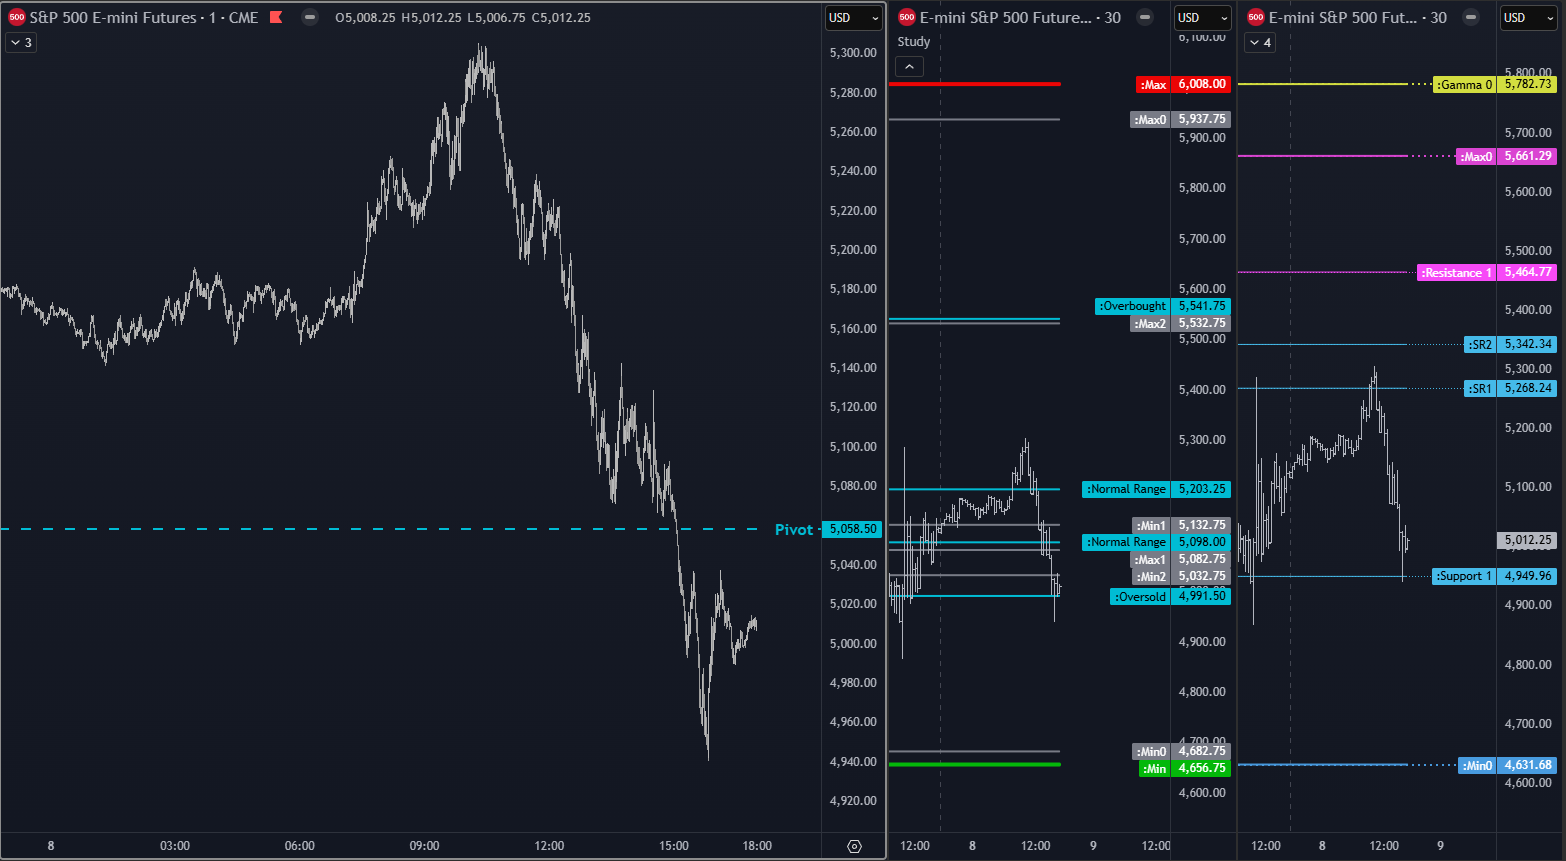
Key Orderflow and Options Levels (ES Futures):

Options Levels (middle and right chart) show significant option prices for the session. Best practice is to look for confluence between levels on center and right chart. These levels should be +/- 5 points max away from each other.
TrendPhase (SPX):

There are three types of signals on this chart, represented by small circles. Circles below price are bullish signals, above price are bearish signals.
Midterm Cumulative:
//Midterm Metrics//
Macro/Positioning: Long
OptionsTrendPhase: Long
Auction/Orderflow: Short
Key takeways:
Options confluence levels: -
Market awaits tariffs retaliation from China today.
At first sight market might seem to move very nervously. But, the thing is, in such circumstances, market is actually quite sloppy and rather predictable. The problem is that even if you can “guess” whats going on most of the time, that time when you have it wrong might crush your acc. So leverage down, stops far away, but set them.
Notes:
Recap of yesterday’s HPI and other options metrics.

Yesterday’s orderflow and options structure.