


Pre-Open Commentary | Apr 8, 25
Condensed Insight Before the Bell.
Key Orderflow and Options Levels (ES Futures):
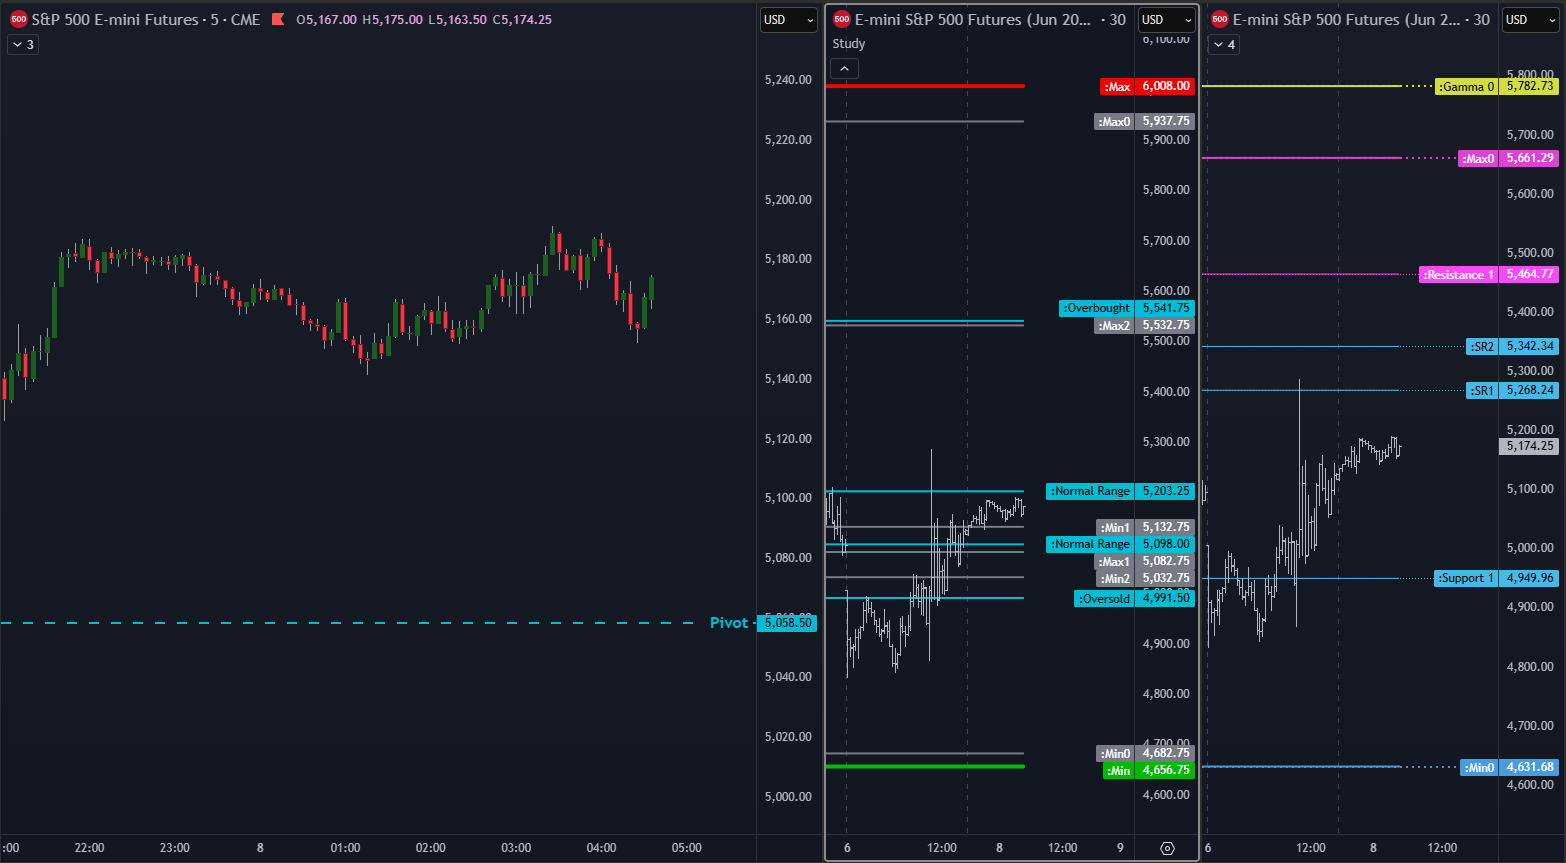
Options Levels (middle and right chart) show significant option prices for the session. Best practice is to look for confluence between levels on center and right chart. These levels should be +/- 5 points max away from each other.
TrendPhase (SPX):

There are three types of signals on this chart, represented by small circles. Circles below price are bullish signals, above price are bearish signals.
Midterm Cumulative:
//Midterm Metrics//
Macro/Positioning: Long
OptionsTrendPhase: Long
Auction/Orderflow: Short
Key takeways:
Options confluence levels: -
Not much changed since yesterday. Market seems to be a bit calmer or rather tired of crazy volatility. But this might be just a temporary break. It takes some time to get back to balance and it wont take a day or two.
Notes:
Recap of yesterday’s HPI and other options metrics + Orderflow Structure.

Yesterday’s orderflow and options structure.
