Pre-Open Commentary | Apr 7, 25
Condensed Insight Before the Bell.
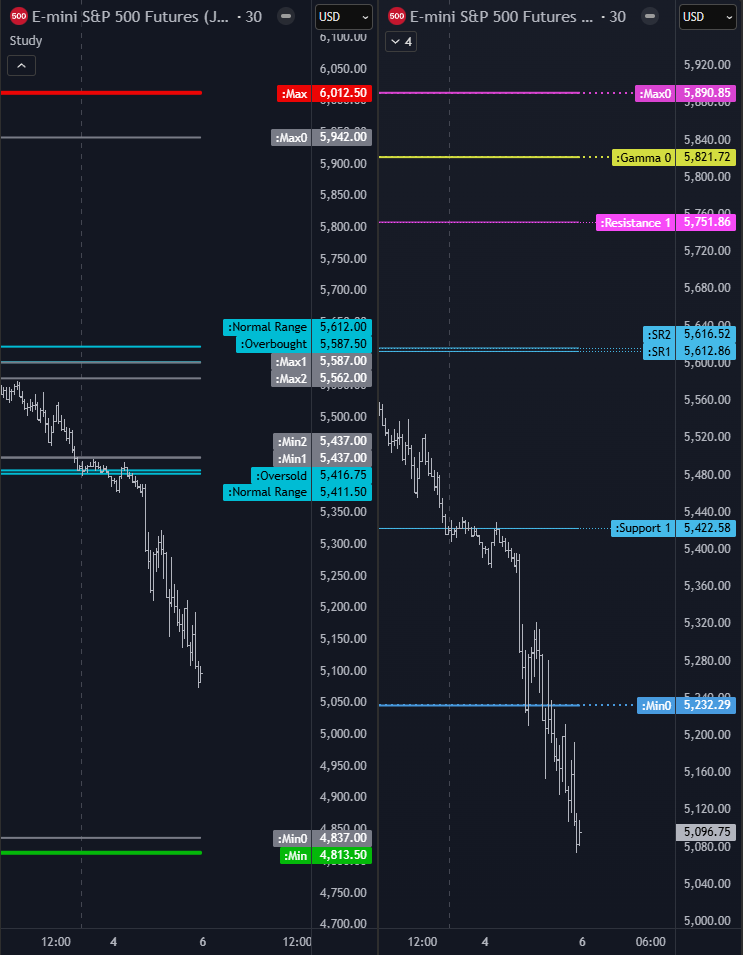
Key Orderflow and Options Levels (ES Futures):

Options Levels (middle and right chart) show significant option prices for the session. Best practice is to look for confluence between levels on center and right chart. These levels should be +/- 5 points max away from each other.
TrendPhase (SPX):

There are three types of signals on this chart, represented by small circles. Circles below price are bullish signals, above price are bearish signals.
Midterm Cumulative:
//Midterm Metrics//
Macro/Positioning: Long
OptionsTrendPhase: Long
Auction/Orderflow: Short
Key takeways:
Options confluence levels: 4782
Midterm strategies, beside auction/orderflow, got hit pretty bad on friday. My longterm view and positions are also hurting, but this one is basically my bad managing - too much too fast. Good thing DXY position made some money but still this is far from perfect situation.
Volatility brings a lot of risk but also opportunity - usually intraday, if played well, pays great. Because of that midterm mess in my positioning I need to be active in short term. Bots are running with wider daily sl. Same with any other technique.
I wrote yesterday on discord, what is the possibility here, in sense what is in play and where this market might bottom. It all comes down to one thing which actually called this drop two years ago when I published a video on my youtube - the bond cycle + some fractal math levels. Unfortunetly it all plays almost to the tick as I drew there. Right now markets are on the way down and its not over - according to this pattern which repeats every time in history.

Obviously this is not 100% prediction. And we are not getting there in a straight line. But the probability of this scenario is pretty high. Don’t ask me why I ignored this completetly in the first place.
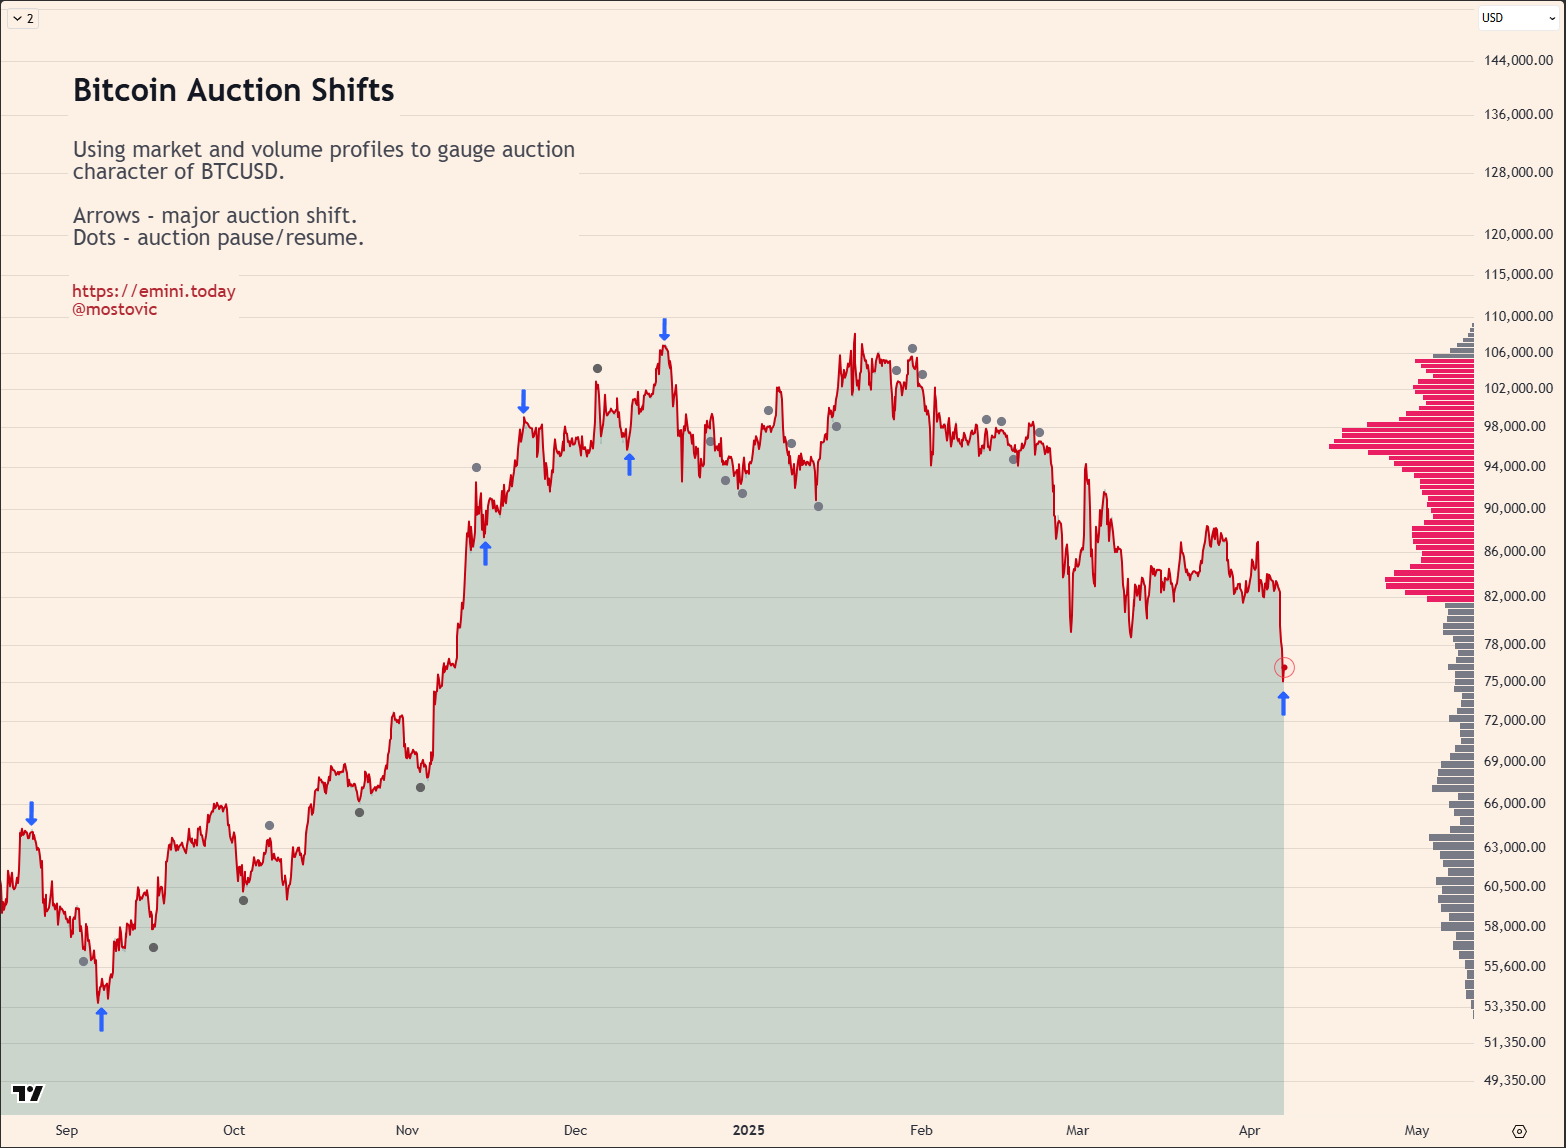
From other news, BTC is setting to make a “perfect” buy setup here.
Notes:
Recap of yesterday’s HPI and other options metrics + Orderflow Structure.

Yesterday’s orderflow and options structure.