


Pre-Open Commentary | Apr 3, 25
Condensed Insight Before the Bell.
Key Orderflow and Options Levels (ES Futures):

Options Levels (middle and right chart) show significant option prices for the session. Best practice is to look for confluence between levels on center and right chart. These levels should be +/- 5 points max away from each other.
TrendPhase (SPX):
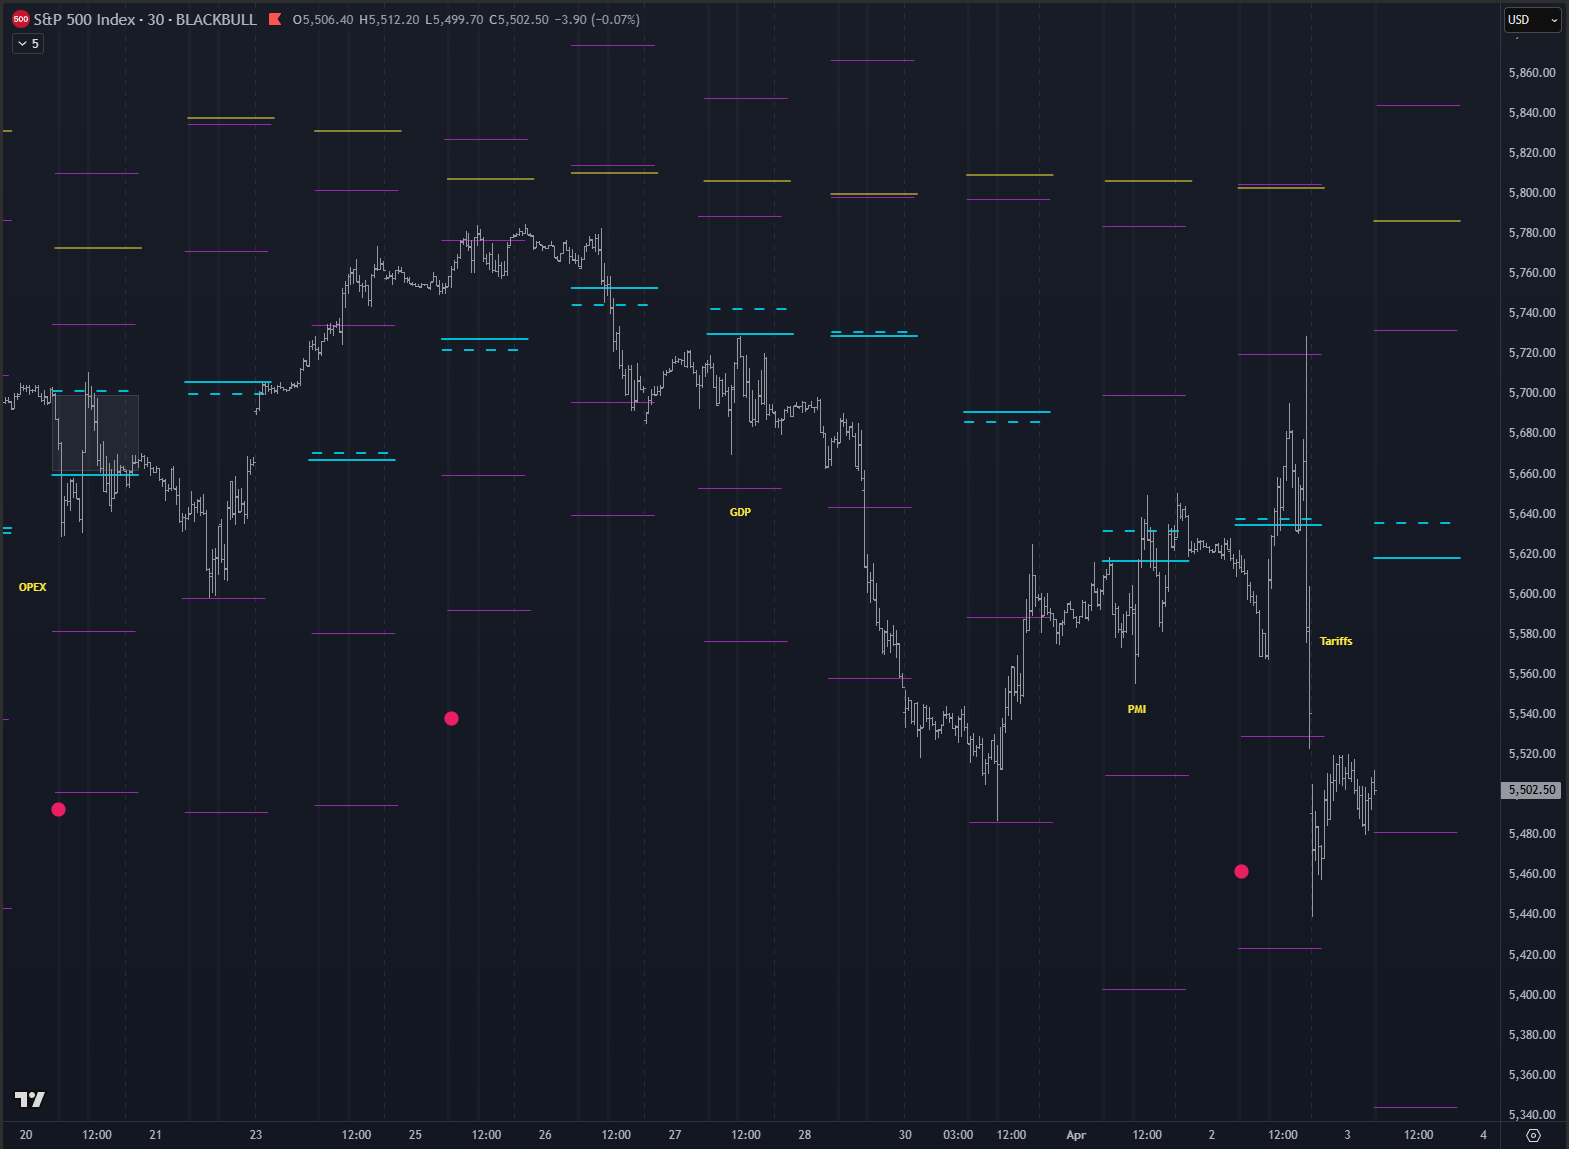
There are three types of signals on this chart, represented by small circles. Circles below price are bullish signals, above price are bearish signals.
Midterm Cumulative:
//Midterm Metrics//
Macro/Positioning: Neutral
OptionsTrendPhase: Long
Auction/Orderflow: Short
Key takeways:
Options confluence levels: 5527-25
Yesterday’s orderflow looks like sh.. so no $ levels for today. Everyone pulled out of the market through tariffs anouncement, there was no liquidity and only market makers seemed to control what is going on and how deep prices were “allowed” to move.
I think I will skip intratrading today.
As to midterm positions, nothing changes for me, im still in a bit too heavy long position. Some option trades unfortunetly lost money so right now most of my position is in SPY and CFD. If you are not already long like me, I would wait for either orderflow/auction or macro/positioning to turn bullish.
Notes:
Recap of yesterday’s HPI and other options metrics + Orderflow Structure.

Yesterday’s orderflow and options structure.
