


Pre-Open Commentary | Apr 2, 25
Condensed Insight Before the Bell.
Key Orderflow and Options Levels (ES Futures):
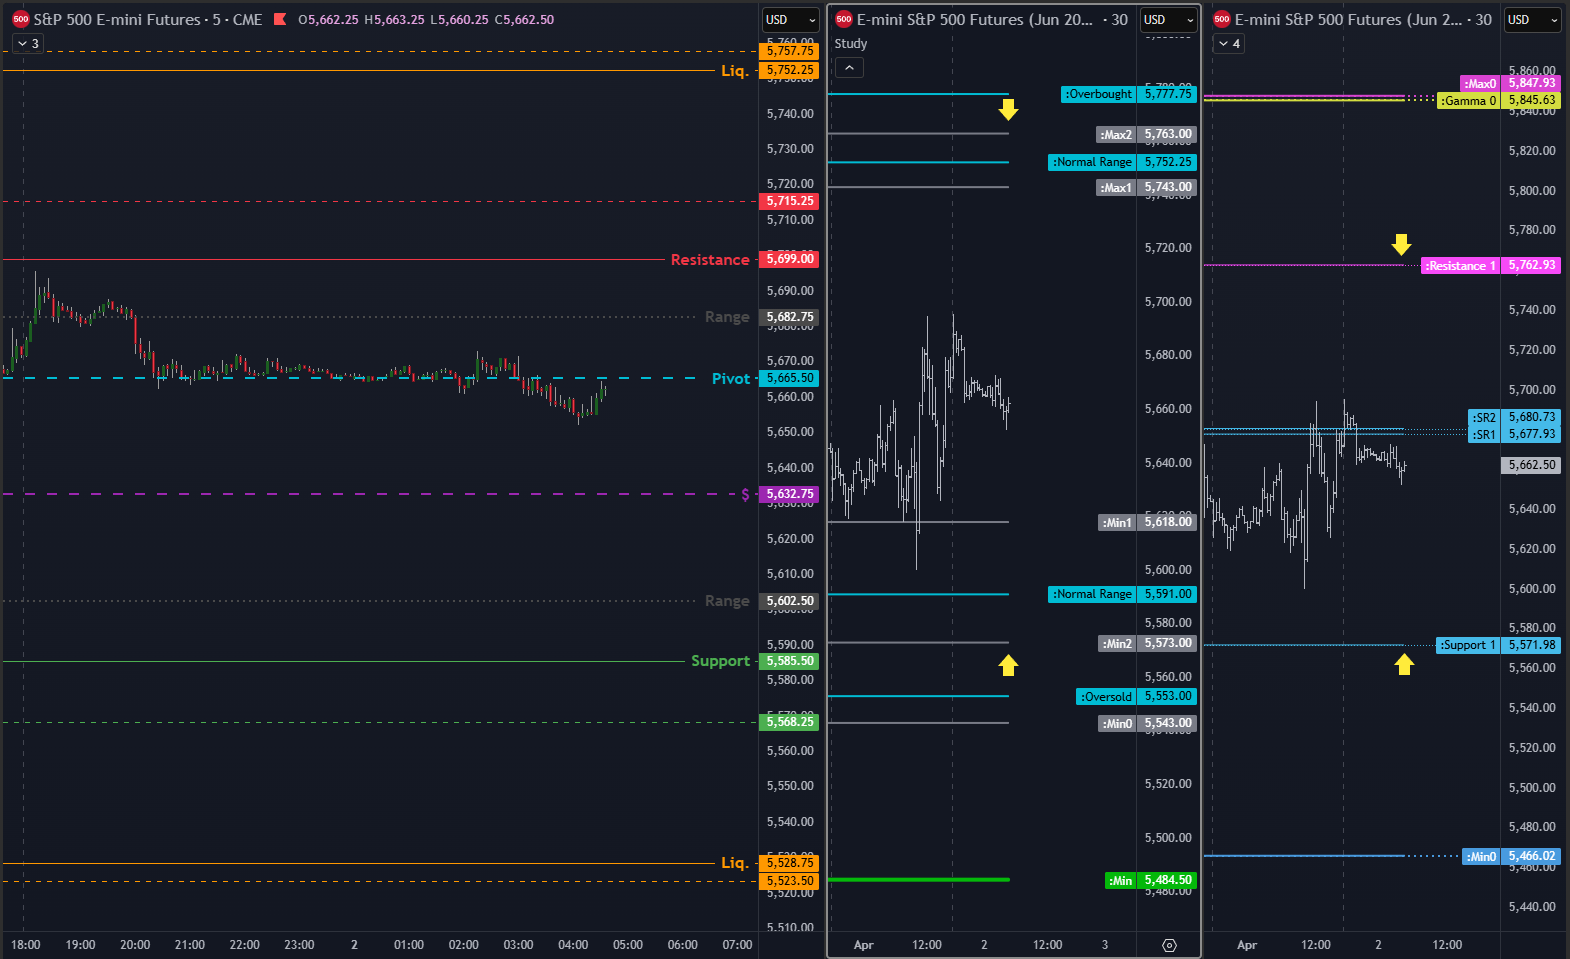
Options Levels (middle and right chart) show significant option prices for the session. Best practice is to look for confluence between levels on center and right chart. These levels should be +/- 5 points max away from each other.
TrendPhase (SPX):

There are three types of signals on this chart, represented by small circles. Circles below price are bullish signals, above price are bearish signals.
Midterm Cumulative:
//Midterm Metrics//
Macro/Positioning: Neutral
OptionsTrendPhase: Long
Auction/Orderflow: Short
Key takeways:
Options confluence levels: 5763 and 5573.
$ level paid multiple times yesterday. Today its still “fresh” at 5633. Pivot break sequence already was initiated with positive result.
Yesterday was a great day for HPI(b) bot, which after update seems to work really nicely. So I am adding a bit more size to it, hopefuly not too early.
Ill be trading $ level, structure support and lower/higher Liq. areas. I think resistance area might be already exploited even though price was like 2pts shy of it multiple times.
Yesterday’s PMI with worse read slightly changed some metrics in macro /positioning to the bearish side. Overall I keep strategy neutral. Fast macro model is now short, slow is still bullish.

Notes:
Recap of yesterday’s HPI and other options metrics + Orderflow Structure.

Yesterday’s orderflow and options structure.
