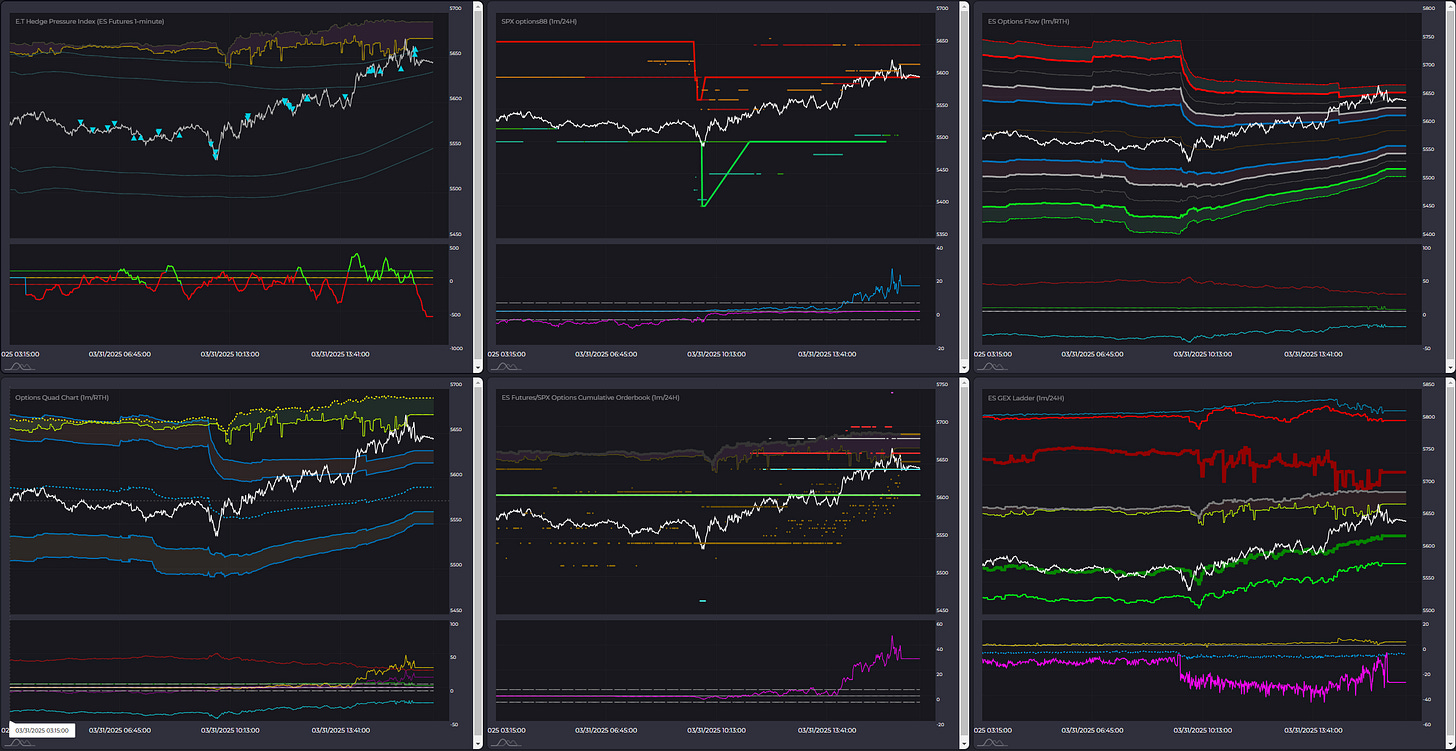
Key Orderflow and Options Levels (ES Futures):
Options Levels (middle and right chart) show significant option prices for the session. Best practice is to look for confluence between levels on center and right chart. These levels should be +/- 5 points max away from each other.
TrendPhase (SPX):
There are three types of signals on this chart, represented by small circles. Circles below price are bullish signals, above price are bearish signals.
Midterm Cumulative:
//Midterm Metrics//
Macro/Positioning: Neutral
OptionsTrendPhase: Long
Auction/Orderflow: Short
Key takeways:
No confluence on options levels.
Same as yesterday, watch $ levels, 5659.75 which I posted on discord already was hit. If price breaks it (about 10 points), treat it as support. Above that we have resistance area 5699-5715 and strong liquidity area 5752. All of these are actionable.
Today we have PMI data, it can change macro/positioning strategy.
Notes:
Recap of yesterday’s HPI and other options metrics + Orderflow Structure.
Yesterday’s orderflow and options structure.


